
According to Zillow’s most recent market report, home sellers pulled back from the August housing market due to sluggish demand from low-income homebuyers—amid other affordability and economic hindrances.
Per the report, there are several opportunities for aspiring homebuyers who are still active in the market, particularly in places where inventory is holding steady. However, the countrywide competitive momentum that has been rapidly shifting in favor of purchasers in recent months appears to be slowing down.
“Buyers who can afford a home and have been waiting for the right moment should look closely at what’s available now,” said Kara Ng, Senior Economist at Zillow. “Options are on the shelves, even if they’re not all fresh. Sidelined buyers should revisit their budget; mortgage rates are lower than recent years, and in some markets, sellers are more willing to deal. But don’t expect this window of opportunity to stay open indefinitely. Buyers’ leverage is easing as many sellers put their plans to list on hold.”
Sellers React to Shifting Buyer Sentiment
Many potential buyers are still turned off by high home costs, which makes it simpler for those who are still looking. According to Zillow’s market heat index, there is less rivalry among buyers than there has been in any August since 2018, and the market is balanced between buyers and sellers countrywide.

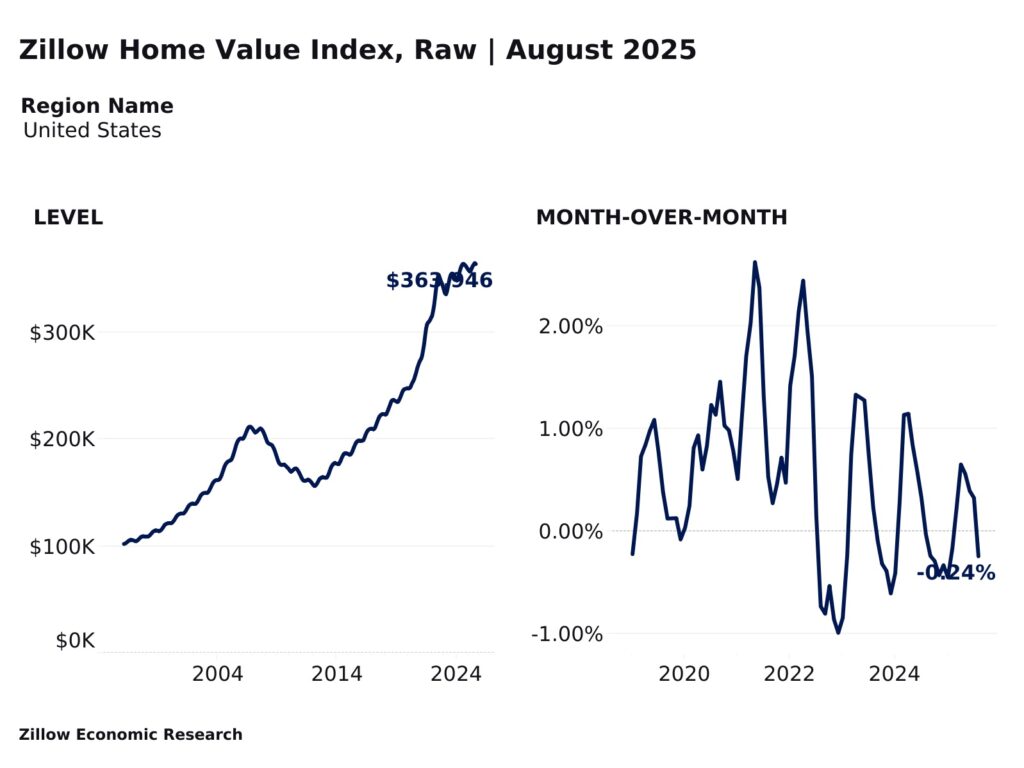
Consequently, the increase in the value of homes has stalled. Zillow’s property Value Index, which measures the average growth in property values throughout the country, has been flat for the past year. This is the second-slowest monthly gain since the beginning of 2018.
Additionally, listings are taking longer to sell. The average August home took 27 days to sell, which is one day longer than pre-pandemic averages and a full week longer than last year. However, in contrast to usual seasonal patterns, competition increased marginally in the latter part of the summer.
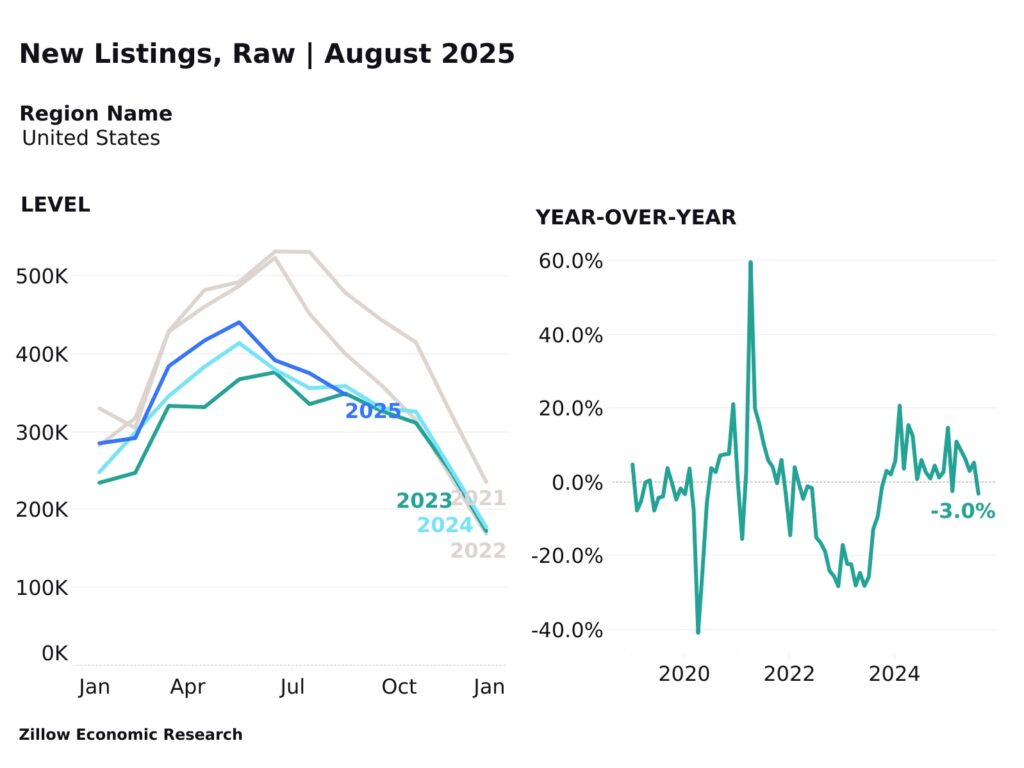
In response to buyers’ hesitancy, homeowners have put their plans to list on hold. According to Zillow data, seller-generated new listings hit a record low for August, and the 7.3% month-over-month (MoM) decline in new listings is more severe than typical for this season.
With a low mortgage rate and substantial equity growth, potential sellers are most likely content with their house for the time being: Since February 2020, the average home value in the country has increased by 46.5%.
An estimated 37% of recent sellers surveyed by Zillow said that accepting a new job helped them to sell. There may be fewer homeowners who need to sell when the labor situation deteriorates. Overall inventory levels decreased as a result of this slowdown in new listing activity, dropping 1.3% from their peak in July.
National Trends Vary by Market
Significant regional variations, where changes in supply have affected competitiveness, are hidden by national patterns.
Buyer-friendly markets: In the South, buyers have the most impact. Thanks in part to builders’ attempts to satisfy demand, there are now more available options in former pandemic-era hotspots like Miami, Tampa, Jacksonville, and Austin than there were prior to the pandemic. A major factor in Seattle’s unexpected shift from favoring sellers to buyers over the past year has been the city’s 22% increase in inventory.
Seller-friendly markets: The San Francisco Bay Area and the Northeast are still strongly in favor of sellers. Boston, San Francisco, San Jose, Buffalo, and Hartford have the fiercest competition. The market is still skewed favor sellers in these supply-constrained areas since inventory is still significantly below pre-pandemic averages.
Additional Findings — U.S.
Home Values:
- The typical U.S. home value is $363,946.
- The typical monthly mortgage payment, assuming 20% down, is $1,855.
- Home values climbed month over month in 2 of the 50 largest metro areas in August. Gains were biggest in Buffalo (0.5%), New Orleans (0.3%), Hartford (0%), Chicago (0%), and Birmingham , AL(0%).
- Home values fell, on a monthly basis, in 45 major metro areas. The largest monthly drops were in San Jose, CA (-1.7%), San Francisco (-1.4%), Austin (-0.8%), Seattle (-0.8%), and San Diego (-0.8%).
- Home values are up from year-ago levels in 25 of the 50 largest metro areas. Annual price gains are highest in Cleveland (4.5%), Hartford, CT (4.2%), Detroit (3.6%), Buffalo, NY (3.6%), and Louisville, KY (3.5%).
- Home values are down from year-ago levels in 25 major metro areas. The largest drops were in Tampa (-6.5%), Austin, Texas (-5.8%), Miami (-4.9%), Orlando, FL (-4.6%), and Dallas (-3.9%).
- The typical mortgage payment is up 1.1% from last year and has increased by 106% since pre-pandemic.
Inventory & New Listings:
- New listings decreased by 7.3% MoM in August.
- New listings decreased by 3% this month compared to last year.
- New listings are 22.2% lower than pre-pandemic levels.
- Total inventory (the number of listings active at any time during the month) in August decreased by 1.3% from last month.
- The median age of inventory, the typical time since the initial list date for active for-sale listings, was 66 days.
- There were 15.3% more listings active in August compared to last year.
- Inventory levels are -19.5% lower than pre-pandemic levels for the month.
Price Cuts & Share Sold Above List Price:
- Approximately 25.8% of listings in August had a price cut. That is down 1.5ppts MoM and is flat compared to last year.
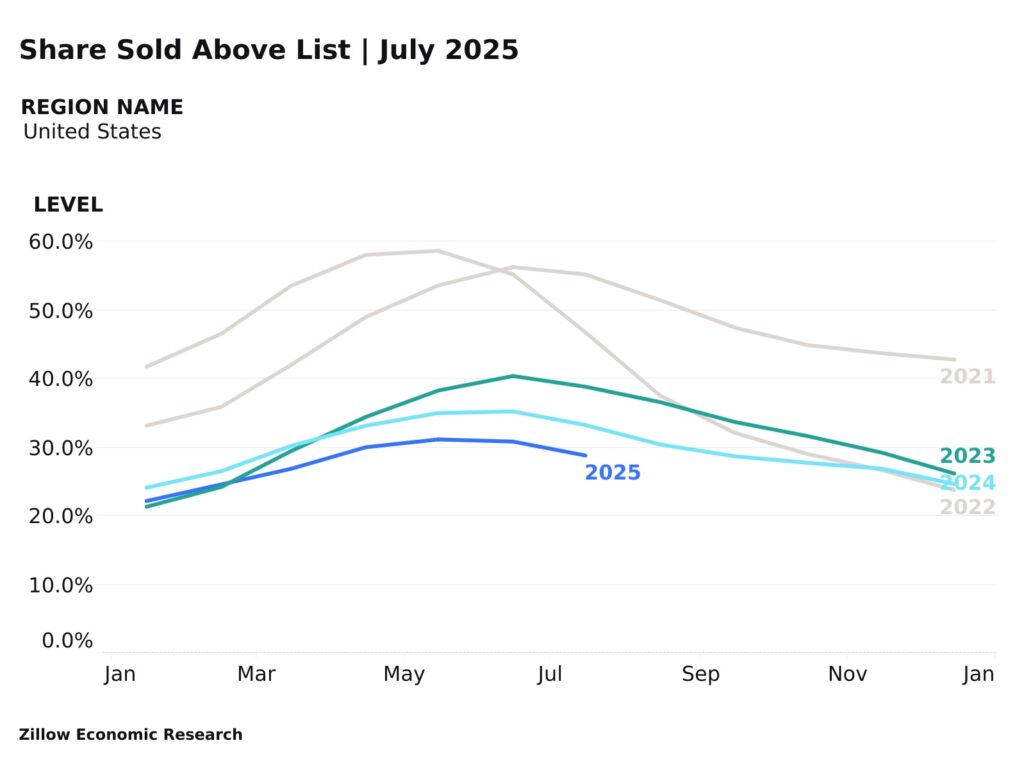
- Roughly 28.8% of homes were sold above their list price last month. That is down 2ppts MoM.
- An estimated 4.4ppts fewer homes sold above their list price compared to last year.
Newly Pending Sales Overview:
- Newly pending listings decreased by 2.6% in August from the prior month.
- Newly pending listings increased by 4.6% from last year.
- Median days to pending, the typical time since initial list date for homes that went under contract in a month, is at 27 days in August, up 3 days since last month.
- Median days to pending increased by 7 days from last year.
To read more, click here.
The post New Listings Drop to Record Low as Sellers Stop Short first appeared on The MortgagePoint.


