
During the four weeks ended June 16, pending home sales declined 3.8% year-over-year, representing the largest drop in over four months—according to a new study from Redfin.
Buyers are also avoiding earlier stages of the house-hunting process. Redfin’s Homebuyer Demand Index, which measures requests for tours and other buying services from Redfin brokers, fell 17% year-over-year, reaching its lowest level since February.

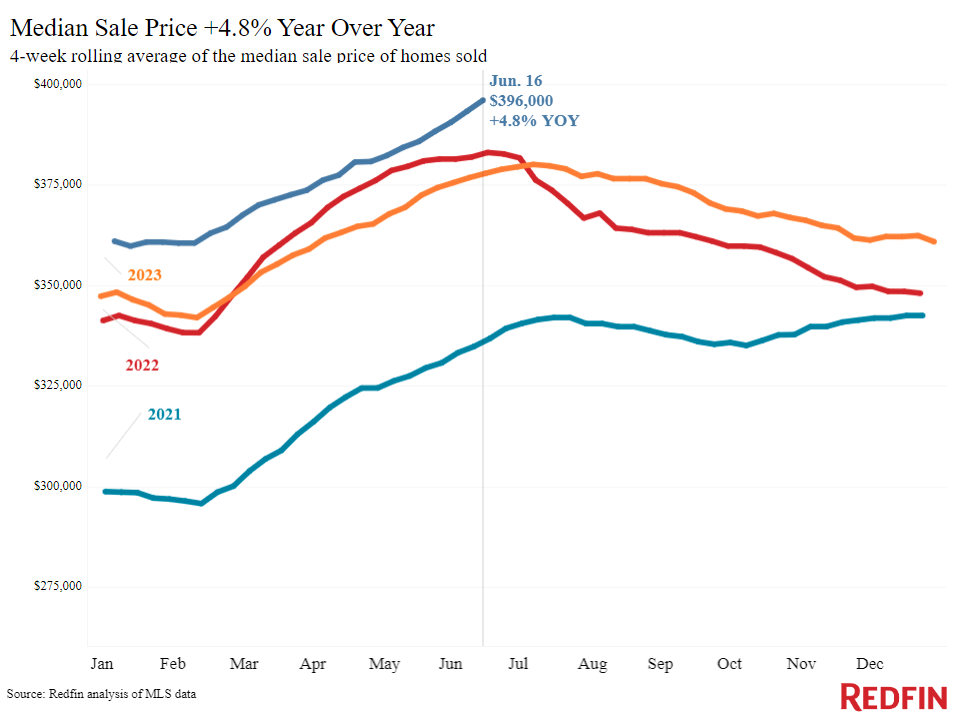
Buyers are retreating primarily due to high home costs. The median home-sale price in the U.S. has risen 4.8% to an all-time high of $396,000, while the median monthly mortgage payment is $2,781, approximately $60 less than the previous record high. The weekly average mortgage rate fell marginally this week to 6.95%, although it remains more than double pandemic-era lows.
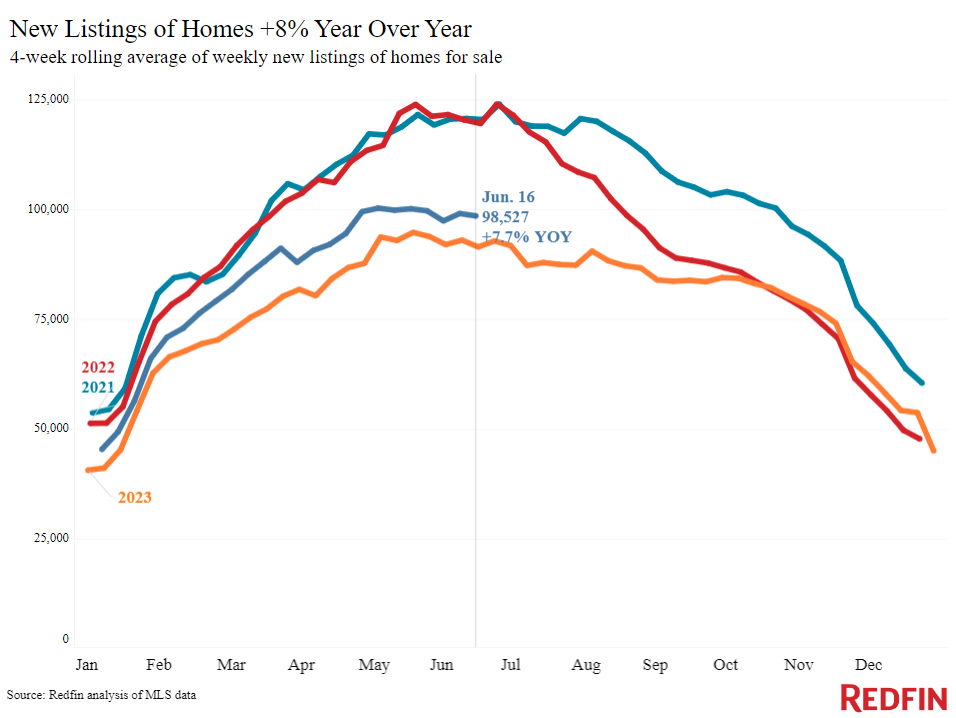
Conversely, new listings remain near historic lows. Another explanation for the drop in pending sales is a scarcity of new, desirable listings for buyers to select from. New listings are up 7.7% year-over-year, but they are still significantly below average for this time of year—the only time on record that June listings were lower was in 2023.
Sellers Scramble as Buyers Demand Move-In Ready Homes
“A few years ago, I never would have told a seller they need to freshen up their paint, fix their furnace and make sure their roof is up to date before putting their home on the market–but now, I tell them to make the house as pretty as they possibly can,” said Des Bourgeois, a Redfin Premier agent in Detroit. “Buyers are still out there and they’re willing to pay today’s high prices, but only if the house is in really good shape. They don’t want to spend extra money on paint or new appliances.”
Many property listings are growing stale, staying on the market for 30 days or more without going under contract. Redfin brokers claim that most buyers are willing to pay exorbitant housing costs only for move-in-ready properties in desirable neighborhoods.
Homes that require repairs and/or are not in the most desired locations can be an excellent option for today’s buyers: In certain cases, they sell for less than the asking price.
“Things have reversed since the pandemic,” said Jonathan Ader, a Redfin Premier agent in the Palm Springs, California area. “Now, most homes—the exception is relatively affordable homes that are move-in ready—are selling under asking price.”
The median sale price was $396,000, representing a 4.8% year-over-year (YoY) change, reaching a new all-time high and the biggest increase since March.
U.S. Metro-Level Highlights: Four Weeks Ending June 16
- The median asking price was $411,749, representing a 5.5% YoY change.
- The median monthly mortgage payment was $2,781 at a 6.95% mortgage rate, representing a 7.8% YoY change—roughly $58 below the all-time high set during the four weeks ending April 28.
- Pending sales were at 86,225, representing a -3.8% YoY change and the biggest decline in nearly four months.
- New listings were at 98,527, representing a 7.7% YoY change.
- Active listings were at 942,916, representing a 16.5% YoY change.
- The months of supply were 3.2, representing a +0.6 pt YoY change.
- The share of homes off the market in two weeks was 42.1%, down from 47% YoY.
- The median days on market were 31, representing a +3-day YoY change.
- The share of homes sold above the list price was 32.2%, down from 36% YoY.
- The share of homes with a price drop was 6.6%, representing a +2.1 pt YoY change, the highest level since November 2022.
- The average sale-to-list price ratio was 99.7%, representing a -0.2 pt YoY change.
Metros with Biggest YoY Increases in Median Sale Price
- Newark, NJ (16.4%)
- Anaheim, CA (16%)
- Nassau County, NY (14.7%)
- New Brunswick, NJ (14.1%)
- Milwaukee (10.7%)
The U.S. median sale price declined in four metros. The metros with the biggest year-over-year decreases were Austin, Texas (-3.7%), San Antonio (-1.5%), Fort Worth, Texas (-1.4%), and Portland, OR (-1.1%).
Metros with Biggest YoY Increases in New Listings
- San Jose, CA (44.1%)
- Phoenix (23.6%)
- San Diego (21.4%)
- Miami (20.5%)
- Seattle (17.1%)
New listings dropped in eight U.S. metros. Chicago (-9.2%), Minneapolis (-6.7%), Atlanta (-5.6%), Newark, NJ (-4.1%), and Portland, OR (-3.9%) all experienced declines.
Pending sales rose in San Jose, CA (13%), Columbus, OH (5.7%), Pittsburgh (5.4%), Anaheim, CA (4.5%), and Los Angeles (4.3%), and increased in fourteen U.S. metros total. Pending sales declined in Houston (-14.5%), West Palm Beach, FL (-12.9%), Miami (-12.3%), New Brunswick, NJ (-10.8%), and Atlanta (-10.7%).
While the mentioned factors may encourage potential homebuyers to shy away from the market, homeownership is not completely out of reach. Mortgage rates are cooling and origination activity is up.
The weekly average 30-year fixed mortgage rate was 6.95% as of the week ending June 13, down slightly from 7.03% two weeks earlier. This is down from a five-month high of 7.22% about a month earlier and up from 6.69%, according to Freddie Mac. Further, mortgage-purchase applications increased 2% from a week earlier as of the week ending June 14, down 12% year-over-year, according to the Mortgage Banker’s Association.
To read the full report, including more data, charts, and methodology, click here.

The post Stale Listings Offer Buyers More Options first appeared on The MortgagePoint.


