
The U.S. Commercial Foreclosure Report, recently released by ATTOM, indicates that the number of commercial foreclosures has steadily increased over time, rising from a low of 141 in May 2020 to 647 in June 2024. This pattern shows a steady rise over the course of the time.
ATTOM’s latest commercial foreclosure activity analysis also noted that Since January 2014, ATTOM has been analyzing data during a period marked by the nation’s emergence from economic uncertainty, starting with 740 commercial foreclosures nationwide. Over the following years, ATTOM monitored fluctuations, observing a peak of 889 commercial foreclosures in October 2014, indicating ongoing market corrections.

The special report found that in June 2020, the U.S. began to see a consistent upward trend in commercial foreclosures after nearly seven years of continuous declines. The first rise was noted in June 2020, from a low of 141 in May 2020, and continued steadily through June 2024. By June 2024, commercial foreclosures had risen to 647, representing a 219% increase compared to the 2020 low.
The analysis also noted that in June 2024, California recorded the highest number of commercial foreclosures for the month, with 214 cases. This represents a 10 percent decrease from the previous month but a 289 percent increase from the same month last year. This is California’s first monthly decline after a significant rise in commercial foreclosures over the past seven months, starting in November 2023, when cases exceeded 100 and continued to escalate.
Also, according to ATTOM’s June commercial foreclosure report, Texas, New York, New Jersey, and Florida recorded the highest numbers of commercial foreclosures in June 2024, following California. While these states experienced decreases this quarter, they exhibited significant fluctuations over the past decade, with each state showing a continuous overall increase.
Texas had a total of 70 commercial foreclosures in June 2024, a 1% decrease from last month and a 100 percent increase from a year ago. Followed by New York which saw an 8% decrease from last month and a 21% decrease from last year. New Jersey experienced a 35% decrease from last month and a 34% increase from last year. Florida had a 45% decrease from last month and a 10% increase from last year.
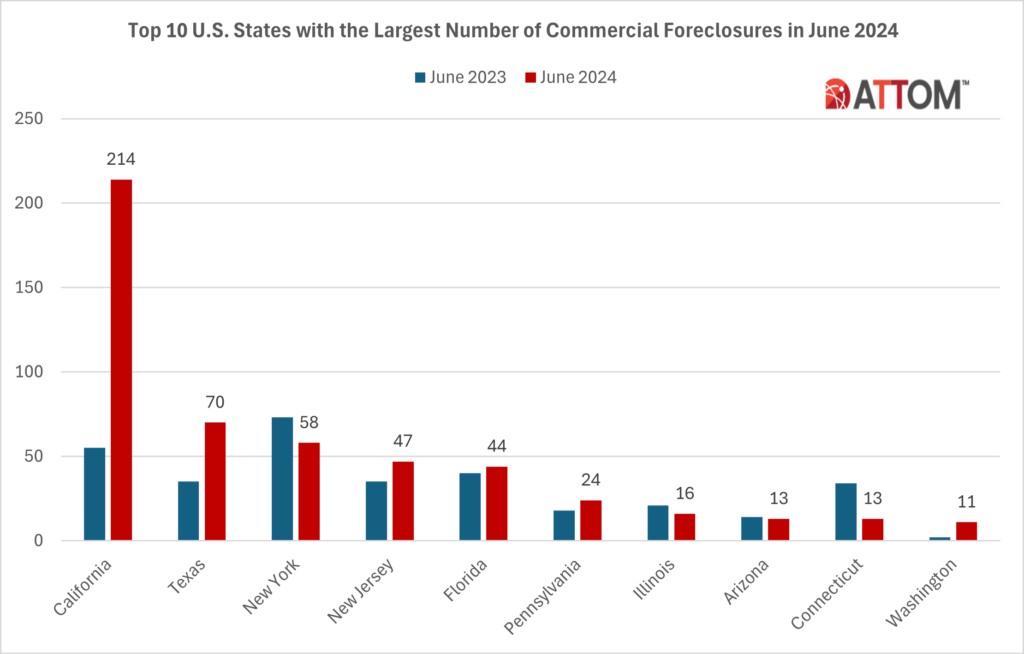
The top 10 U.S. states with the highest number of commercial foreclosures in June 2024:
#1 – California
- June 2024 Commercial Foreclosures: 214
- June 2023 Commercial Foreclosures: 55
- YoY % Change: 289 percent
#2 – Texas
- June 2024 Commercial Foreclosures: 70
- June 2023 Commercial Foreclosures: 35
- YoY % Change: 100 percent
#3 – New York
- June 2024 Commercial Foreclosures: 58
- June 2023 Commercial Foreclosures: 73
- YoY % Change: -21 percent
#4 – New Jersey
- June 2024 Commercial Foreclosures: 47
- June 2023 Commercial Foreclosures: 35
- YoY % Change: 34 percent
#5 – Florida
- June 2024 Commercial Foreclosures: 44
- June 2023 Commercial Foreclosures: 40
- YoY % Change: 10 percent
#6 – Pennsylvania
- June 2024 Commercial Foreclosures: 24
- June 2023 Commercial Foreclosures: 18
- YoY % Change: 33 percent
#7 – Illinois
- June 2024 Commercial Foreclosures: 16
- June 2023 Commercial Foreclosures: 21
- YoY % Change: -24 percent
#8 – Arizona
- June 2024 Commercial Foreclosures: 13
- June 2023 Commercial Foreclosures: 14
- YoY % Change: -7 percent
#9 – Connecticut
- June 2024 Commercial Foreclosures: 13
- June 2023 Commercial Foreclosures: 34
- YoY % Change: -62 percent
#10 – Washington
- June 2024 Commercial Foreclosures: 11
- June 2023 Commercial Foreclosures: 2
- YoY % Change: 450 percent
To read the full report, including more data, charts, and methodology, click here.
The post Which States Are Experiencing the Largest Number of Commercial Foreclosures? first appeared on The MortgagePoint.


