
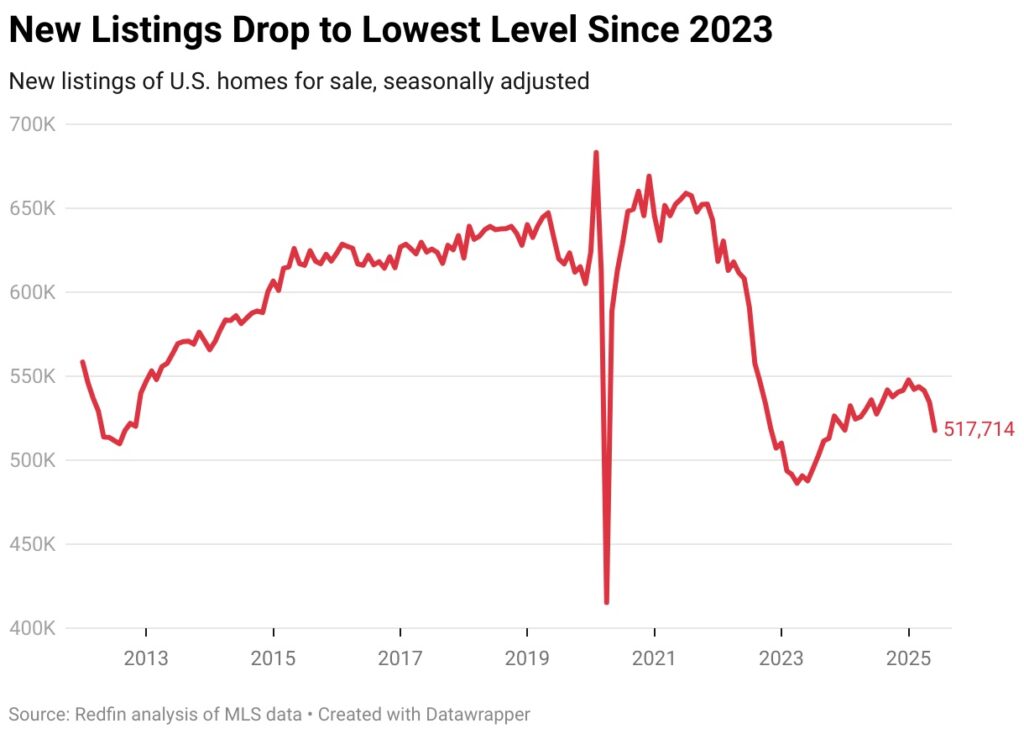
According to a new Redfin study, new home listings for sale in the U.S. dropped 3.2% in June to the lowest seasonally adjusted level since October 2023. Since February 2023, that is the largest month-over-month (MoM) drop. For the first time since October 2023, new listings decreased 3.4% annually.
In June, the total number of properties for sale, or active listings, decreased by 0.3% MoM. Seasonally adjusted, that is the first drop since July 2023. Active listings, however, were up 13.3% from the previous year and were close to their highest level in five years.
“The balance of power in the housing market has shifted toward buyers because listings have piled up and demand has slowed down,” said Asad Khan, Senior Economist at Redfin. “Prospective sellers are feeling discouraged by this new reality. Some are reacting by staying put or renting their homes out instead of selling—especially if they’re at risk of taking a haircut.”
The decrease in listings is a turnaround from the beginning of the year, when the U.S. housing market was experiencing an increase in supply. As the lock-in effect on mortgage rates loosened, listings piled up, and demand also slowed as a result of high housing costs and economic uncertainties. After seeing their houses sit on the market for weeks or even months, sellers were compelled to reduce their asking prices. Some people are now choosing not to sell.
“For many folks who bought at the peak of the pandemic market, selling might not be the best option right now,” said Connie Durnal, a Redfin Premier real estate agent in the Dallas area. “I have several clients who purchased their homes in early 2022 and need to move, but the math is just really, really tight. I’m advising them to lease their homes out if they can’t afford to take a loss. I think I will have a lot of clients coming back to list this time next year.”
Key Findings — National
- Pending sales rose most in Virginia Beach, VA (14.4%), Dallas (8.2%) and Warren, MI (8.1%). Six of the 10 metros where pending sales rose fastest are in the Rust Belt, which has attracted homebuyers because it’s relatively affordable.
- Prices rose most in Newark, NJ (8.9%), Detroit (8.6%) and Cleveland (8.1%). Six of the 10 metros where prices rose fastest are in the Rust Belt.
- Prices fell most in Oakland, CA (-4.6%), West Palm Beach, FL (-4.1%), and Jacksonville, FL (-3.9%). Of the 12 metros where prices fell, four are in Florida and three are in Texas. Housing markets across Florida and Texas have cooled rapidly amid a surge in homebuilding, rising insurance costs and extreme weather events.
- New listings rose most in Warren, MI (13%), Boston (9.8%) and Cincinnati (8.9%). Five of the 10 metros where new listings rose fastest are in the Rust Belt.
- Florida saw the biggest uptick in days on market: In Miami, the typical home that went under contract did so in 88 days, up 23 days from a year earlier—the biggest increase among the metros Redfin analyzed. Next came Fort Lauderdale, FL (+17 days), and Orlando, FL (+16 days).
- Days on market dropped in three metros: Kansas City, MO (-8 days), Chicago (-1 day) and New York (-1 day).
- Homes were most likely to sell above their list price in Newark, NY (69.6% of homes sold above list), Nassau County (58.2%) and San Francisco (58.1%).
June Home Prices Reach Record While U.S. Sales Drop
In June, pending home sales decreased 2.4% year over year and 2.2% MoM, reaching their lowest level since November 2023 on a seasonally adjusted basis. The seasonally adjusted annual rate for existing-home sales was 4,159,943, which was the lowest level in nine months but not much different from a month and a year ago.
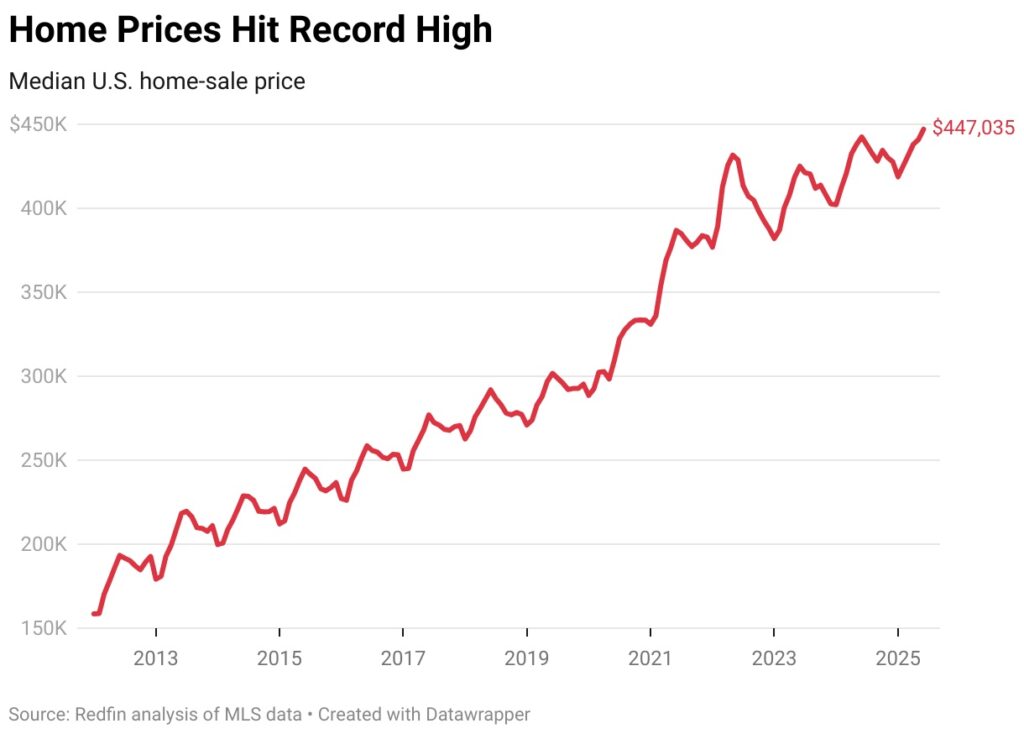
Due to the exorbitant cost of housing, almost 57,000 home-purchase agreements were terminated in June. This amounts to 14.9% of all residences that were under contract last month, which is the highest June rate since 2017. Mortgage rates were close to 7%, more than double the pandemic-era record low, and the median home sale price reached a record high of $447,035 in June.
The good news for purchasers is that prices aren’t increasing as swiftly as they used to; in June, the median sale price increased 1% year over year, which was about the same as the 0.7% growth the month before, which was the weakest in about two years.
Another indication that purchasers have negotiating leverage is the decreased likelihood of homes selling for more than their asking price. June had the lowest June share in five years, with less than one-third (30.9%) of properties sold for more than their advertised price. According to Redfin, by the end of 2025, home values will start to decline annually.
According to Redfin agents, it’s crucial for sellers to ensure that their properties are reasonably priced and in good shape during periods of low demand. Additionally, they advise buyers not to discount homes that are out of their price range because sellers might be open to making concessions or lowering the asking price.
The average June home that went under contract was on the market for 39 days, which was the greatest period for any June since 2020 and an increase from 33 days the year before.
The June share was the lowest since 2017, with about two out of five (38.3%) of residences that went under contract doing so in less than two weeks, compared to 43.1% a year earlier.
June 2025 Housing Market Highlights — National
| Metrics | June 2025 | MoM change | YoY change |
| Median sale price | $447,035 | 1.4% | 1% |
| Existing-home sales, seasonally adjusted annual rate | 4,159,943 | -0.4% | 0.4% |
| Pending home sales, seasonally adjusted | 469,806 | -2.2% | -2.4% |
| Homes sold, seasonally adjusted | 411,841 | -1.4% | -1.3% |
| New listings, seasonally adjusted | 517,714 | -3.2% | -3.4% |
| Total homes for sale, seasonally adjusted (active listings) | 1,929,956 | -0.3% | 13.3% |
| Months of supply | 2.9 | -0.2 | 0.2 |
| Median days on market | 39 | 1 | 7 |
| Share of homes that sold above final list price | 30.9% | -0.3 ppts | -4.2 ppts |
| Average sale-to-final-list-price ratio | 99.3% | -0.1 ppts | -0.6 ppts |
| Pending sales that fell out of contract, as % of overall pending sales | 14.9% | 0.8 ppts | 1 ppts |
| Monthly average 30-year fixed mortgage rate | 6.82% | 0 ppts | -0.1 ppts |
To read more, click here.
The post U.S. New Home Listings Hit Two‑Year Low first appeared on The MortgagePoint.


