
According to the National Association of Realtors (NAR) Pending Home Sales Report, pending home sales fell approximately 0.8% in January compared to the previous month and 0.4% year-over-year (YoY). The report gives information on the number of house transactions under contract to the real estate ecosystem, which includes agents, buyers, sellers, and homebuyers.
Pending home sales decreased in the Northeast and South and increased in the Midwest and West from month-over-month. In the South and West, pending house sales increased YoY, whereas in the Northeast and Midwest, they decreased.
“The National Association of Realtors Pending Home Sales Index showed that new contract activity declined slightly in January,” said Lisa Sturtevant, Chief Economist at Bright MLS. “Pending home sales nationally fell by 0.8% compared to December and were down 0.4% year-over-year. Despite lower mortgage rates, affordability concerns and economic uncertainty are holding buyers back at the beginning of 2026. Wintery weather also likely dampened home buying activity.”
MoM Data:
- 0.8% decrease in pending home sales
- Gains in the Midwest and West; declines in the Northeast and South
YoY Data:
- 0.4% decrease in pending home sales
- Gains in the South and West; declines in the Northeast and Midwest
“Pending home sales eased at the start of the year, the modest decline suggests buyers are still approaching the market carefully even as affordability conditions improve,” said Sam Williamson, Senior Economist at First American. “The details, though, were more constructive than the headline. Contract activity rose in the Midwest, up 5.0% month-over-month, and West. up 4.3%, and on a year-over-year basis the South, up 4.0%, and West, up 0.3%, were modestly higher. Several large metros also stood out for stronger annual gains—Phoenix, Boston, and Charlotte, each up about 11%, along with San Francisco and Oklahoma City—signs that buyer interest is beginning to re-emerge where conditions are improving.”
Prospective closings can be predicted with the help of pending contracts. However, not all housing transactions experience the same length of time between pending contracts and completed sales. Problems like the buyer’s inability to secure mortgage financing, complications with the house inspection, or appraisal concerns can all contribute to variations in the time it takes from pending contract to closed sale.
“It’s also worth treating January data with caution. Seasonal slowdowns and winter weather can distort both contract activity and closings, and existing-home sales also posted a sizable decline in January,” Williamson said. “The softer pace is also giving supply more time to catch up ahead of the busy spring home-buying season: single-family inventory rose 4.7% from December, and months’ supply increased to 4.2 months on a seasonally adjusted basis, up from 3.8 months. More homes on the market should give buyers more options and help keep price pressures in check as activity picks up.”
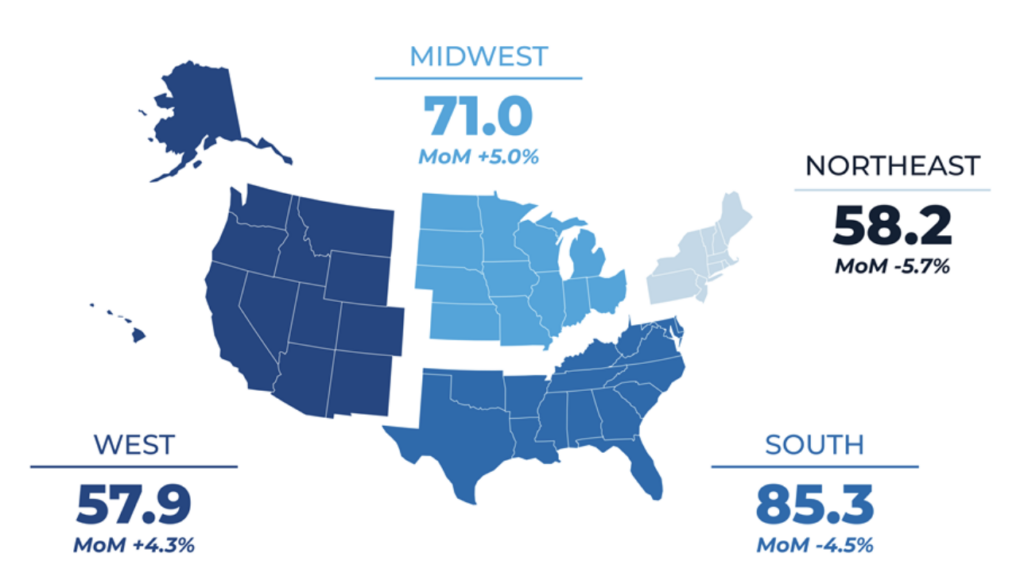
Regional Pending Home Sales Overview — January 2026
Northeast:
- 5.7% decrease MoM
- 8.3% decrease YoY
Midwest:
- 5.0% increase MoM
- 3.3% decrease YoY
South:
- 4.5% decrease MoM
- 4.0% increase YoY
West :
- 4.3% increase MoM
- 0.3% increase YoY
“A lack of inventory is also a constraint in some markets,” Sturtevant said. “NAR reports that new pending sales were down year-over-year in the Midwest and Northeast where supply is lowest. It is likely that we will see more home buying activity over the coming months as inventory improves. Spring is typically the busiest market when homes sell the quickest and offers come in at or above list price. But this year buyers will have more leverage than they have had in recent years. Sellers will need to get their home ‘move-in ready’ and priced appropriately if they want a quick sale.”

Several local housing markets are seeing significant YoY growth, despite a modest decline in national pending home sales in January.
“Improving affordability conditions have yet to induce more buying activity,” said Dr. Lawrence Yun, Chief Economist for NAR. “With mortgage rates nearing 6%, an additional 5.5 million households that could not qualify for a mortgage one year ago would qualify at today’s lower rates. Most newly qualifying households do not act immediately, but based on past experience, about 10% could enter the market—potentially adding roughly 550,000 new homebuyers this year compared with last year.”
According to data from Realtor.com Economics, the top 10 regions with the largest annual gains in pending house sales among the 50 largest metro areas were:
- Phoenix–Mesa–Chandler, AZ (+11.8%)
- Boston–Cambridge–Newton, MA-NH (+10.7%)
- Charlotte–Concord–Gastonia, NC-SC (+10.7%)
- San Francisco–Oakland–Fremont, CA (+8.9%)
- Oklahoma City, OK (+8.7%)
- St. Louis, MO-IL (+8.0%)
- Virginia Beach–Chesapeake–Norfolk, VA-NC (+7.6%)
- San Diego–Chula Vista–Carlsbad, CA (+7.5%)
- San Antonio–New Braunfels, Texas (+7.4)
- Miami–Fort Lauderdale–West Palm Beach, FL (+6.8%)

“Unless housing supply increases, these additional potential buyers becoming active in the market could simply push up home prices,” Yun said. “This will put increasing pressure on affordability, which is why it is critical to increase supply by building more homes. Fortunately, the House of Representatives recently passed the Housing for the 21st Century Act with strong bipartisan support, an important signal that addressing the nation’s housing shortage remains a shared priority. The legislation is a meaningful step toward expanding housing supply and removing barriers that make it harder for Americans to achieve homeownership.”
The Pending Home Sales Index typically outpaces existing-home sales by a month or two when a home enters into a contract a month or two prior to being sold.
“Even with a slow start to the year, we remain cautiously optimistic that lower rates, improving supply, and cooler price growth will make 2026 more constructive for buyers, Williamson said. “Importantly, other leading indicators are moving in a better direction—purchase mortgage applications are near their highest level in roughly three years—suggesting underlying demand is gradually firming as we head into spring.”
The next Pending Home Sales for February 2026 will be reported on Tuesday, March 10, and released on Tuesday, March 17, at 10 a.m. Eastern.
The post Homebuyers Pull Back Slightly to Start 2026 first appeared on The MortgagePoint.


